Categories
Important Concepts
Explore public health and scientific concepts below.
Reliability vs. Validity
Reliability and validity are two very important concepts related to measurements and methods in research. All valid measurements and methods are reliable, but not all reliable measurements and methods are valid.
To make accurate conclusions, it is important that our measurements and methods are both reliable and valid.
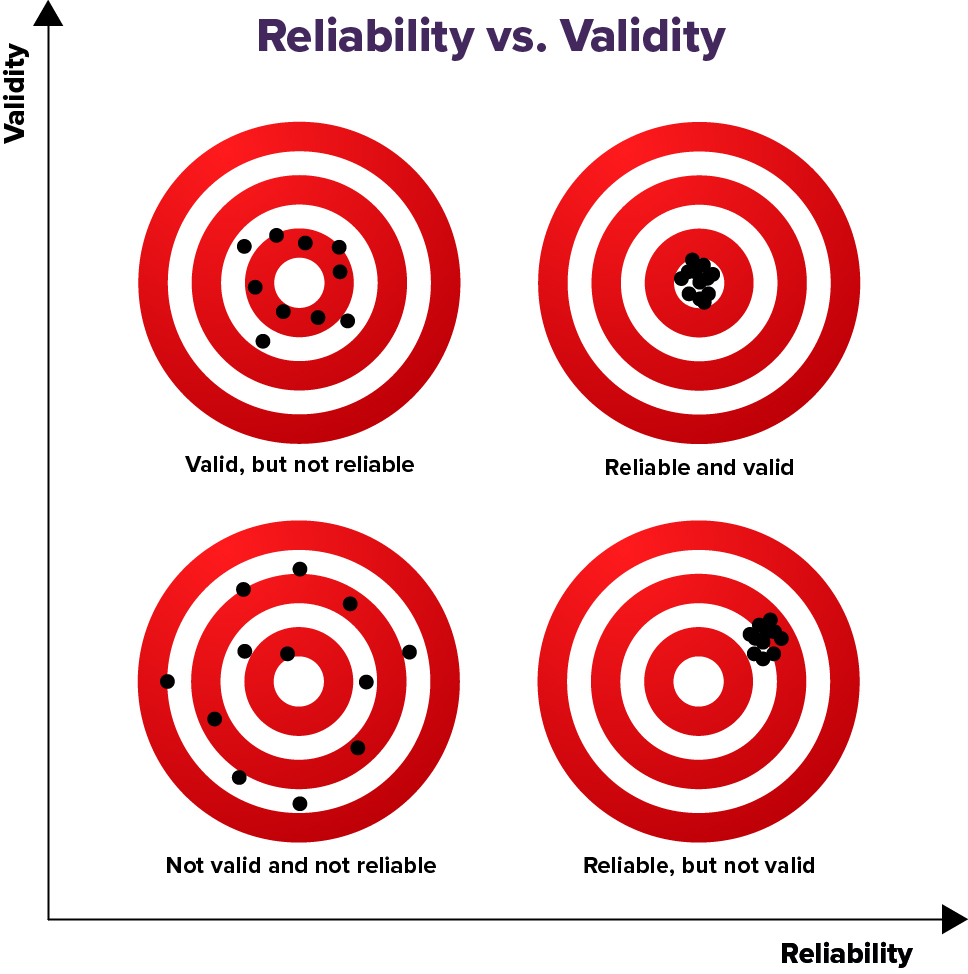
Reliability is how consistent a measurement or method is. In research, if the results or measurements are the same (or similar) over repeated measurements--then those results or measurements and those methods of getting them are reliable.
Examples:
- Measuring your weight repeatedly on the same scale and getting the same (or similar) results every time under similar conditions.
- Measuring your temperature repeatedly with the same thermometer and getting the same (or similar) results every time under similar conditions.
Validity refers to how well a measurement represents what is true. In research, if results or measurements obtained from different, reliable methods are the same (or similar) over repeated measurements--then those results and the methods of getting them are valid. They likely represent what is true.
Examples:
- Measuring your weight using different scales and getting the same (or similar) results every time under similar conditions.
- Measuring your temperature using different thermometers and getting the same (or similar) results every time under similar conditions.
Random Error vs. Nonrandom Error
Random error, also known as chance error, affects the precision of measurements. Random error refers to unpredictable, inconsistent changes that can happen each time you measure or observe something. These differences are usually caused by factors that are either unknown or beyond our control.
Example: You have an apple that weighs 150 grams (g). If you weigh it several times, you might get a slightly different result each time--like 150g, 152g, 149g, 151g, 148g, or 150g.
Nonrandom error, also known as systematic error, affects the accuracy of measurements. Nonrandom error is a predictable, consistent error that happens each time you measure or observe something. This type of error usually happens because there is a problem with the system, tools, or procedures used for measuring or observing.
Example: You have an apple that weighs 150g. If the scale is not working correctly and adds 10g to each measurement, that extra 10g is a nonrandom, or systematic error. It’s nonrandom because it happens the same way every time.
Key Differences Between Random and Nonrandom Errors
Feature Random Error Nonrandom Error Pattern Unpredictable, inconsistent Predictable, consistent Cause Natural variation, chance Faulty tool, biased method Fixability Reduced by repeating and averaging Must be identified and corrected Primarily Affects Precision Accuracy Sensitivity vs. Specificity
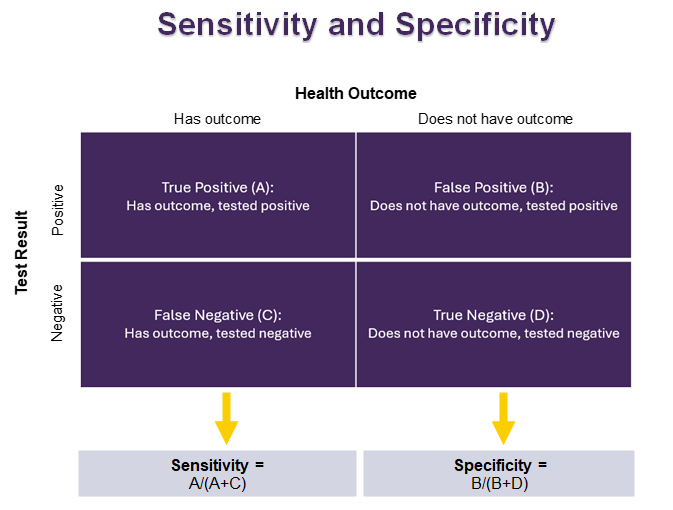
Sensitivity and specificity are used to see how well a test correctly identifies people who do or do not have a certain health outcome. These two measures are important for creating tests that are both accurate and consistent. This helps us to successfully identify individuals with specific health outcomes.
Sensitivity shows how many people who have a health outcome test positive.
- It ranges from 0 to 100%, with a higher percent indicating higher sensitivity.
- If a test is very sensitive:
- It is good at finding the health outcome when it is there.
- There are not many false negatives. A false negative is when the test says someone doesn’t have the health outcomes, but they really do.
Specificity shows how many people who do not have the health outcome test negative.
- It ranges from 0 to 100%, with a higher percent indicating higher specificity.
- If a test is very specific:
- It is good at saying that someone does not have the health outcome when they really don't.
- There are not many false positives. A false positive is when the test says someone has the health outcome, but they really don’t.
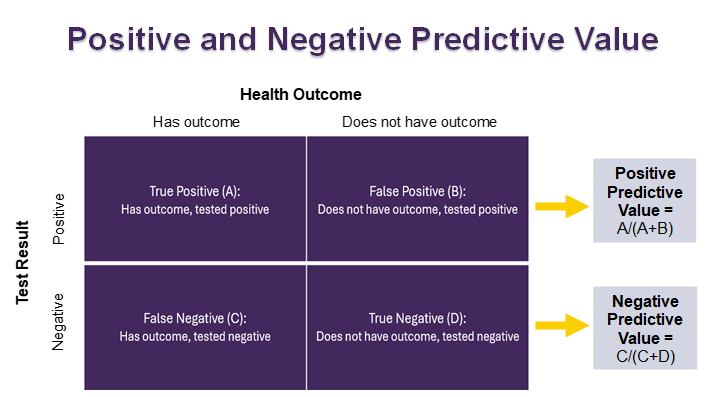
Positive Predictive Value vs. Negative Predictive Value
Positive predictive value and negative predictive value help us figure out how likely it is that a given test result is correct. This helps us determine whether further testing may be necessary to confirm or rule out health outcomes.
Positive predictive value (PPV) shows the chance that someone has a health outcome if they tested positive for it.
- Ranges from 0 to 100%, with a higher percent indicating higher positive predictive value.
- If a test has a high positive predictive value:
- There is a high chance that a person has the health condition if they test positive for it.
- There is a low chance that a person does not have the health condition if they test positive for it.
Negative predictive value (NPV) shows the chance that someone does not have a health outcome if they tested negative for it.
- Ranges from 0 to 100%, with a higher percent indicating higher negative predictive value.
- If a test has a high negative predictive value:
- There is a high chance that a person does not have the health condition if they test negative for it.
- There is a low chance that a person does have the health condition if they test negative for it.