Categories
Important Concepts
Explore public health and scientific concepts below.
Incidence vs. Prevalence
Epidemiologists use the terms incidence and prevalence to measure the occurrence of a health condition or outcome on a specific population.
Incidence is the number of new cases of a health outcome that happens in a population over a specific time.
Example: In 2023, 10,000 people resided in Town X. There were 20 new lung cancer cases that year. The incidence would be 20 out of 10,000 people. See the section on “Risk vs. Rate” to learn more about how epidemiologists measure incidence.
Prevalence is the number of cases (including new and existing) of a health outcome in a population at a specific time.
Example: In Town X in 2023, in addition to the 20 new lung cancer cases from that year, there were 50 existing cases of lung cancer (people diagnosed in the years prior, who were still alive, still living in Town X, and still had lung cancer). Thus, the prevalence of lung cancer in Town X in 2023 would be 70 out of 10,000. Both of the following can influence the prevalence of a health condition: changes in the number of cases of a health outcome, and changes in the population. For example, people moving, dying, or recovering from a health condition.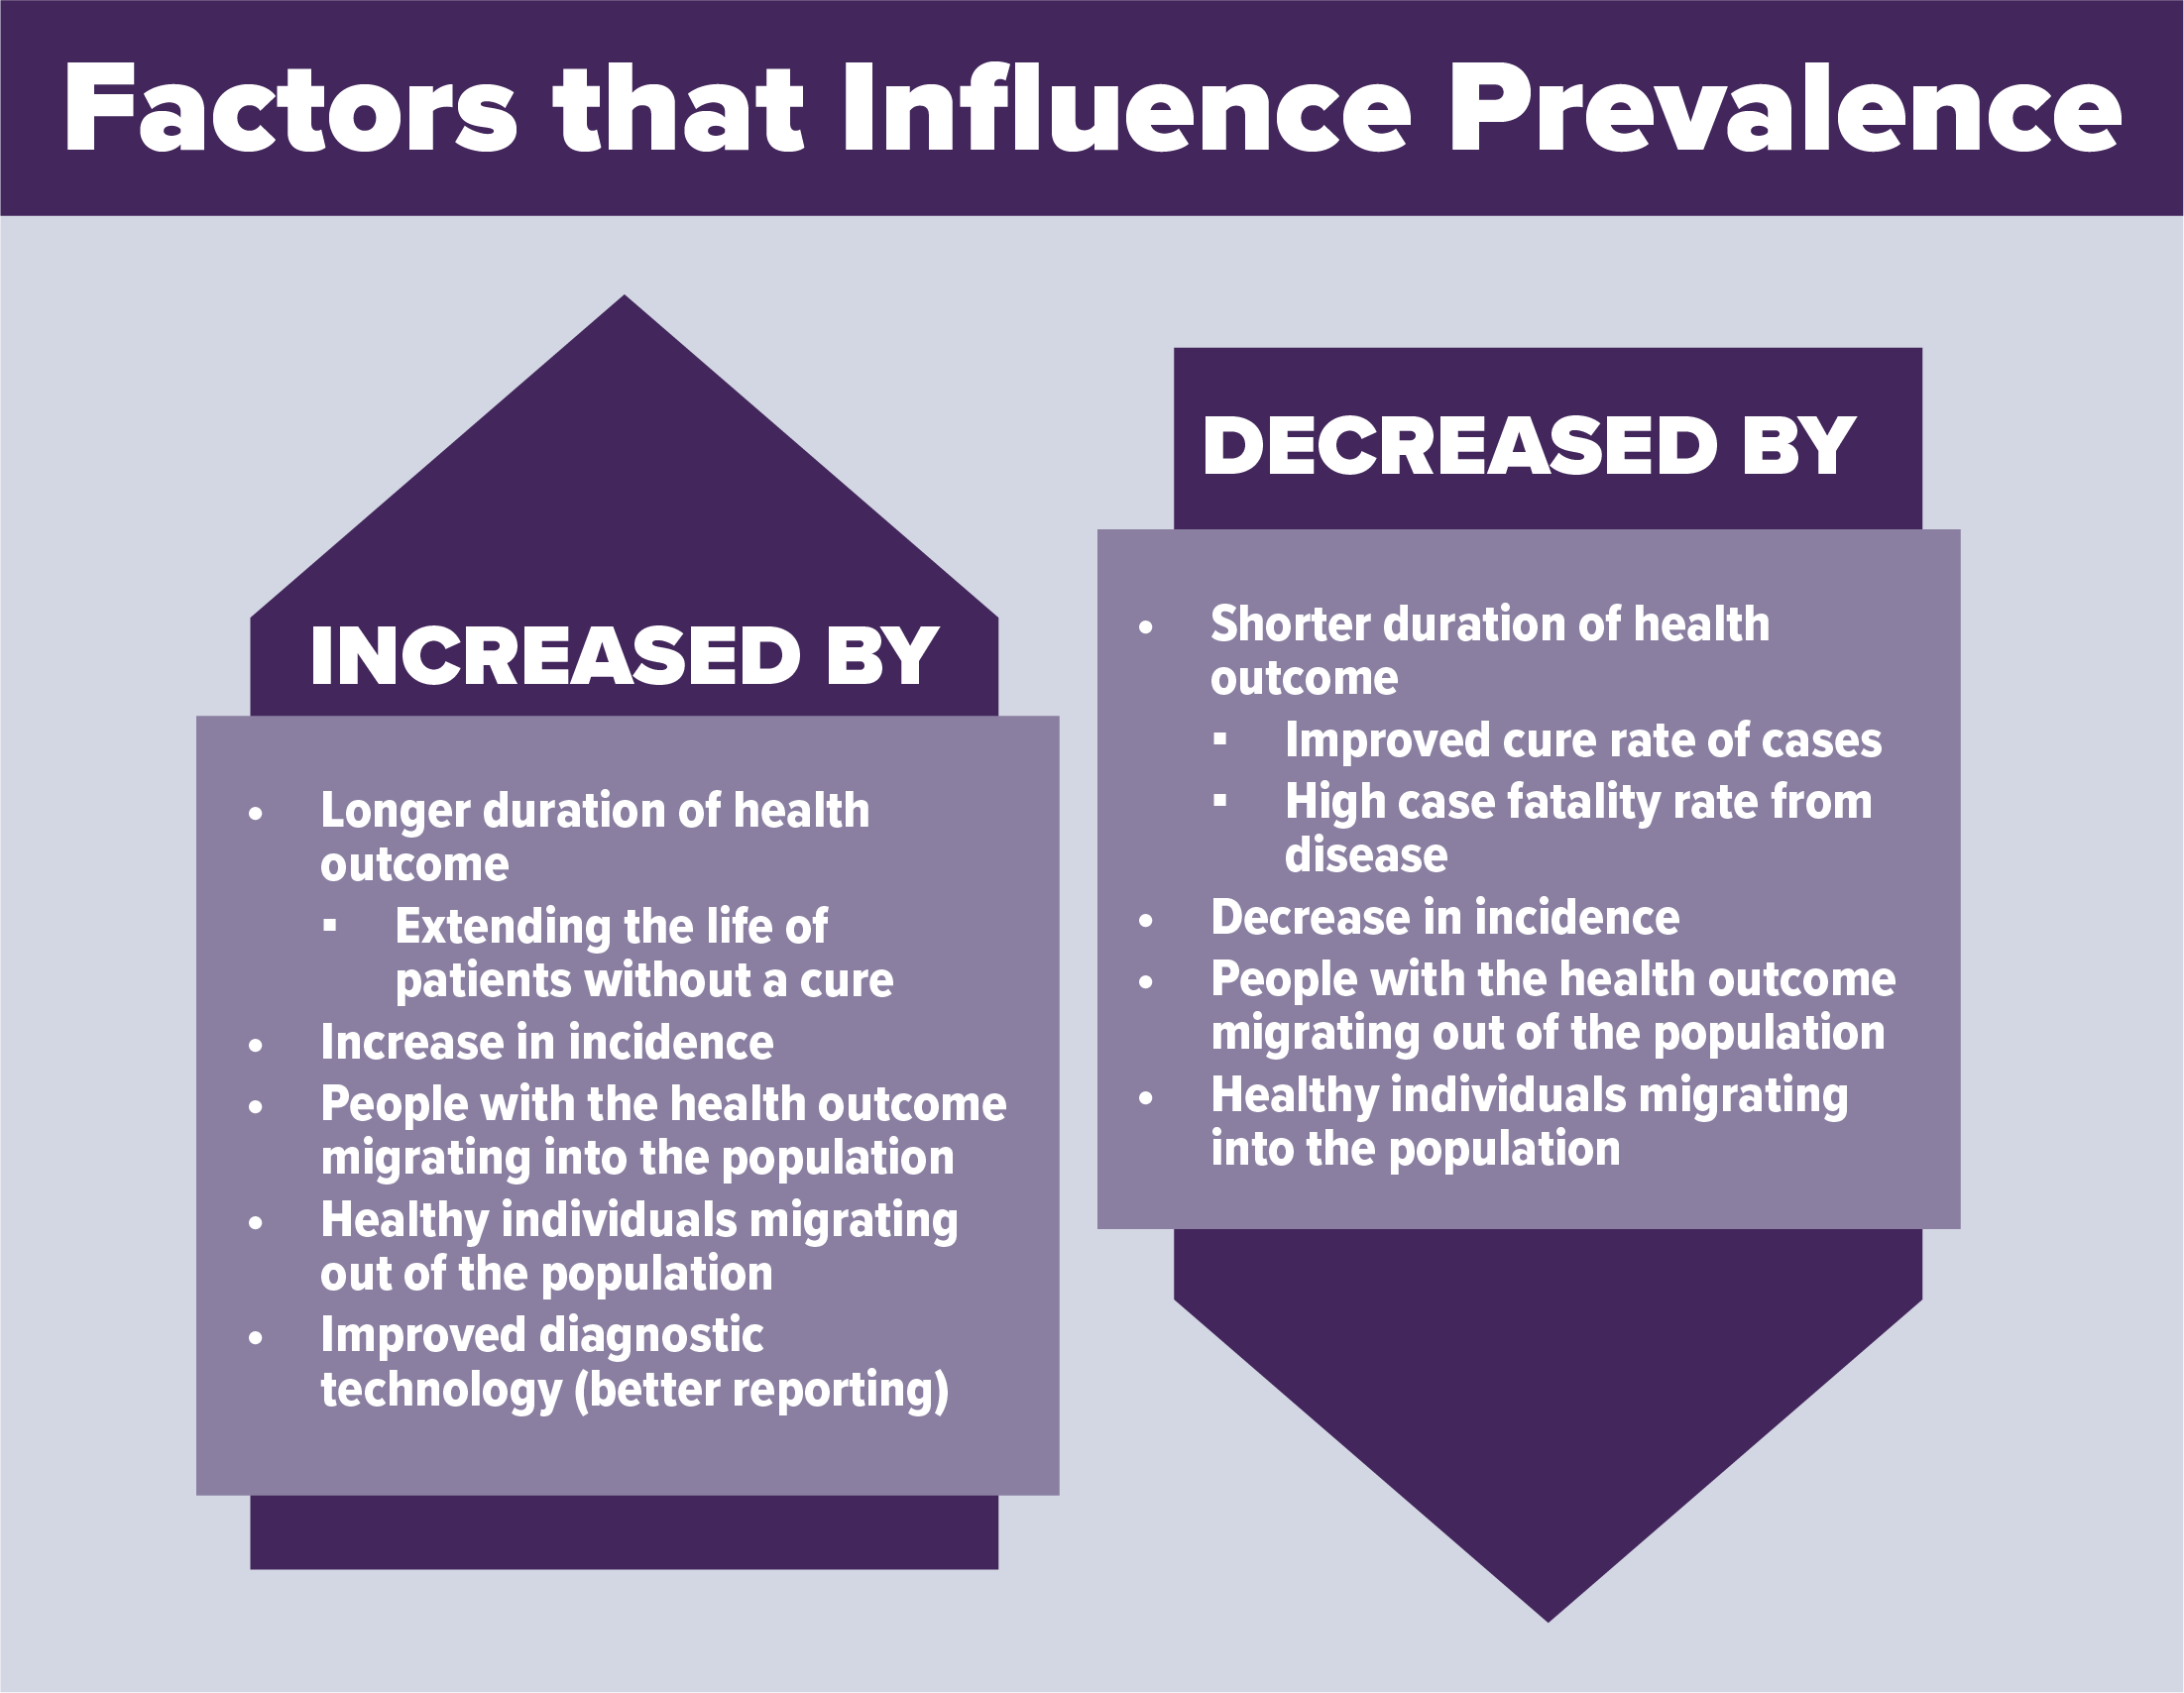
Morbidity vs. Mortality
Epidemiologists use two different terms to describe the impact of a health condition or outcome on people: morbidity and mortality.
Morbidity measures the presence of a condition that negatively affects health or quality of life. Morbidities can be short-term, like an illness or injury, or long-term, like a chronic disease.
Examples: Flu, asthma, obesity, cancer, and Alzheimer's disease. A person can have more than one morbidity at the same time – which epidemiologists call comorbidity.
Mortality is the measure of how many people died from a specific health condition or event.
Example: The number of people who died from lung cancer in New York State in 2022.
Risk vs. Rate
Both ‘risk’ and ‘rate’ are used to measure disease incidence, the occurrence of new disease cases.
Risk can be defined as the probability (chance) that an individual in a specific group will develop a certain health outcome over a specific period. Risk is often expressed as a percentage or fraction that tells you how likely it is for the health outcome or condition to occur.
A rate is a measurement that tells us how many cases of a health outcome or condition are happening in a population over a specific period. To make the rate easier to understand, it is often multiplied by a number like 10,000 or 100,000.
Example: In New York State in 2021, there were 119,678 new cases of lung cancer among 19,854,426 residents.
To calculate the risk:
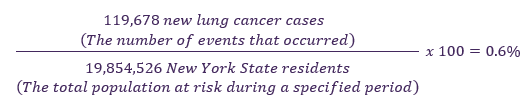
Among New York State residents in 2021, there was a 0.6% risk of lung cancer.
Example: In New York State in 2021, there were 77,214 asthma-related emergency department visits among an average population of 19,854,526 people.
To calculate the rate:
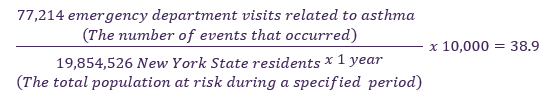
Among New York State residents in 2021, asthma-related emergency department visit rate was 38.9 per 10,000 New York State residents. In other words, for every 10,000 New York State residents, there were about 39 asthma-related emergency department visits.
Risk Ratio vs. Rate Ratio
In epidemiology, both the risk ratio and the rate ratio are specific quantities that we calculate to measure an association between a risk factor and an outcome. The risk factor could be a demographic group or a health behavior. The outcome may or may not be causal, as discussed earlier.
In specific, they are used to compare how likely a health outcome or condition is in one group of people compared with another. They can be used to find out if a certain group is more at risk for a health outcome or to determine if a certain exposure (like a risk factor, a behavior, or a new treatment) makes an outcome more or less likely.
The risk ratio compares the risk of a health outcome among one group with the risk in another group.
The rate ratio compares the rate of a health outcome among one group with the rate in another group.
How to calculate risk and rate ratios:
- Risk Ratio
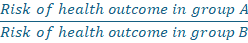
Tells us how many times more likely group A is to get the health outcome compared with group B, over a specified period.
- Example: Consider if the risk ratio for smokers (group A) getting lung cancer compared with nonsmokers (group B) was 5.0. This would mean smokers are 5 times as likely to develop lung cancer than nonsmokers during the specified period.
- Rate Ratio
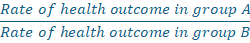
- Tells us how many times faster cases of the health outcome are occurring in group A compared with group B, over a specified period.
- Example: Consider if the rate ratio for lung cancer comparing smokers (group A) to nonsmokers (group B) was 10.0, This would means the rate of lung cancer is occurring at 10 times the rate (or 10 times the speed) in smokers compared to nonsmokers.
How to interpret risk and rate ratios:
- If the ratio is greater than 1, it means group A is at greater risk than group B.
- If the ratio is near or equal to 1, it means that group A and B are at equal risk.
- If the ratio is less than 1, it means that group A is at less risk than group B.