Categories
Important Concepts
Explore public health and scientific concepts below.
What Is Epidemiology?
It is a type of public health science. People who work in this field are known as epidemiologists, sometimes called health detectives. They investigate how diseases are spread, where they come from, and how to stop them.
Epidemiology is the foundational (basic or core) science of public health. It is the study of the distribution (frequency and patterns) and determinants (risk factors or causes) of a health condition or outcome in a group of people.
Epidemiological data and research help us gather key information about health conditions and outcomes, including:
- Who is most at risk in terms of individual characteristics (age, sex, etc.), behavioral, and other ‘risk’ factors
- What the features of the outcome are (symptoms, frequency of cases, impacts)
- Where and when the health condition is occurring
- Why and how the health condition develops or spreads
This information is then used to create ways to prevent, treat, and manage health conditions.
Example: Epidemiological research shows that young children and older adults are most at risk of getting the flu during the colder months. This is why young children and older adults should get their flu vaccine before the colder months.
Population vs. Sample
In epidemiological research, the population is the group of people we want to study for a health issue and draw conclusions about. Populations can be very broad or very specific, depending on the health outcome and research question being studied.
Examples of populations include:
- United States adults 18 or older
- Men ages 18-35 living in Albany County, NY from 1993-2000
- New York State school-aged children
It is often very difficult, time-consuming, and expensive to study and collect information from every member of the population. A sample refers to the smaller group from the overall population who we are able to study or collect information about. Researchers do their best to make sure the sample is as similar to the population as possible.
Descriptive vs. Etiologic Epidemiology
Descriptive epidemiology focuses on describing the patterns of a health outcome. It can show how a health outcome varies by person, place, and time. In other words, which factors are associated with the outcome, but it does not necessarily explain the cause(s) of the outcome.
Etiologic epidemiology focuses on the possible cause(s) of a health outcome. Etiologic is pronounced "ee-tee-uh-LAJ-ik."
In the next section, we explore in a little more depth the difference between ‘cause’ and ‘association.’
Cases and Exposures
In epidemiology, we often want to understand health outcomes (cases) in a population and the factors that may cause or be associated with them (exposures).
Cases refer to individuals who have a particular health outcome that we are interested in studying. This includes a disease, condition, or other health outcome of interest. For example, received a vaccine, enrolled in a health program, went to the emergency department.
Exposures refer to factors or events that may be associated with a health outcome. These include, but are not limited to: individual characteristics, behaviors, medical treatments, environmental conditions, or other factors that may make someone more or less likely to experience the health outcome.
Example: Let’s say we are interested in identifying whether people who smoke are more likely to be diagnosed with lung cancer. In this example, the exposure is the behavior of smoking, and cases would be defined as those who are diagnosed with lung cancer.
Causality vs. Association
Causality shows that one event, or exposure, causes an event that follows it. The event that follows the exposure is called the "outcome." This means if the cause had not been present or hadn’t taken place, the outcome would not have occurred.
Association shows that there is a relationship between two events. But just because there is an association between two events, does not mean that one event causes the other. Sometimes there is an underlying issue that links both events. Public Health scientists refer to this issue as a confounder.
Example: If we look at the number of sunburns and the amount of ice cream sold every day for an entire year, we will likely find an association. But we will not find a causal relationship between the two.
- On days with higher ice cream sales, there are also a lot of sunburns--an association.
- Clearly ice cream sales do not cause sunburns, and sunburns do not cause ice cream sales to go up.
- In this example, the reality is that a third factor (hot and sunny weather) is the cause of both outcomes. The hot and sunny weather causes people to buy more ice cream and causes more sunburns.
Incidence vs. Prevalence
Epidemiologists use the terms incidence and prevalence to measure the occurrence of a health condition or outcome on a specific population.
Incidence is the number of new cases of a health outcome that happens in a population over a specific time.
Example: In 2023, 10,000 people resided in Town X. There were 20 new lung cancer cases that year. The incidence would be 20 out of 10,000 people. See the section on “Risk vs. Rate” to learn more about how epidemiologists measure incidence.
Prevalence is the number of cases (including new and existing) of a health outcome in a population at a specific time.
Example: In Town X in 2023, in addition to the 20 new lung cancer cases from that year, there were 50 existing cases of lung cancer (people diagnosed in the years prior, who were still alive, still living in Town X, and still had lung cancer). Thus, the prevalence of lung cancer in Town X in 2023 would be 70 out of 10,000. Both of the following can influence the prevalence of a health condition: changes in the number of cases of a health outcome, and changes in the population. For example, people moving, dying, or recovering from a health condition.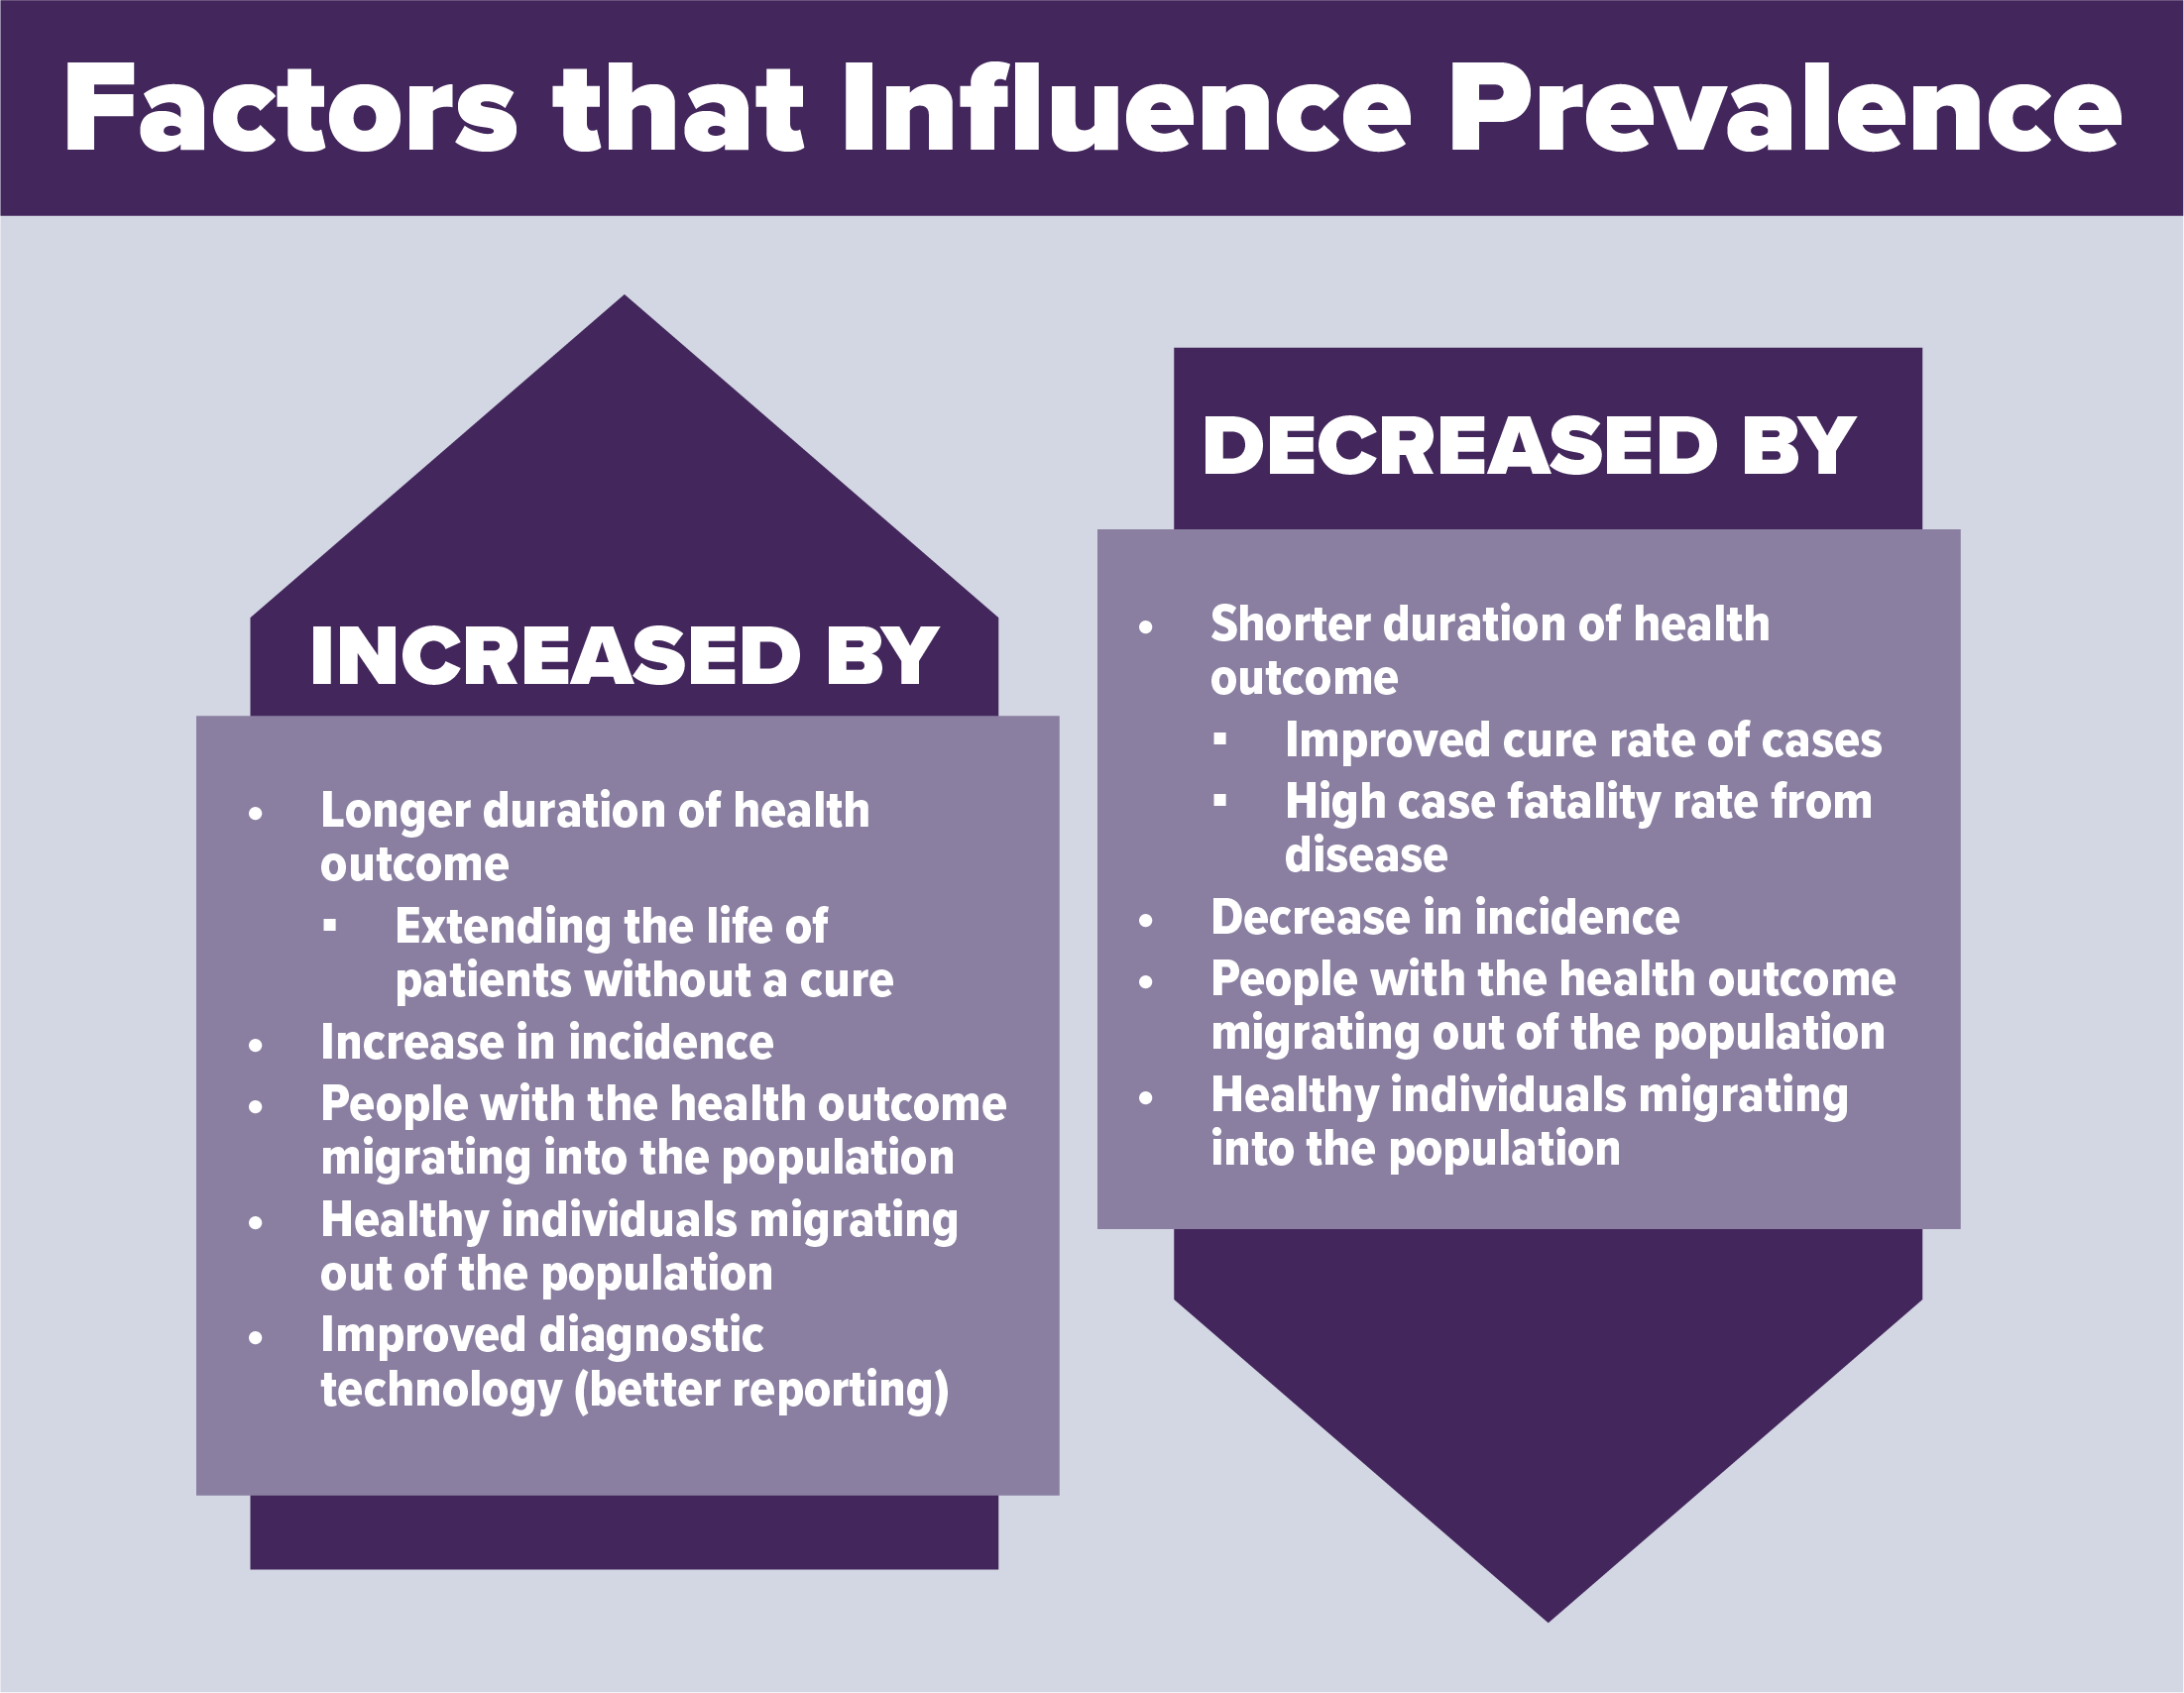
Morbidity vs. Mortality
Epidemiologists use two different terms to describe the impact of a health condition or outcome on people: morbidity and mortality.
Morbidity measures the presence of a condition that negatively affects health or quality of life. Morbidities can be short-term, like an illness or injury, or long-term, like a chronic disease.
Examples: Flu, asthma, obesity, cancer, and Alzheimer's disease. A person can have more than one morbidity at the same time – which epidemiologists call comorbidity.
Mortality is the measure of how many people died from a specific health condition or event.
Example: The number of people who died from lung cancer in New York State in 2022.
Risk vs. Rate
Both ‘risk’ and ‘rate’ are used to measure disease incidence, the occurrence of new disease cases.
Risk can be defined as the probability (chance) that an individual in a specific group will develop a certain health outcome over a specific period. Risk is often expressed as a percentage or fraction that tells you how likely it is for the health outcome or condition to occur.
A rate is a measurement that tells us how many cases of a health outcome or condition are happening in a population over a specific period. To make the rate easier to understand, it is often multiplied by a number like 10,000 or 100,000.
Example: In New York State in 2021, there were 119,678 new cases of lung cancer among 19,854,426 residents.
To calculate the risk:
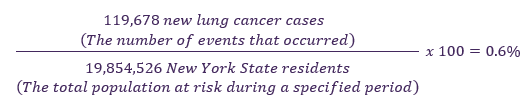
Among New York State residents in 2021, there was a 0.6% risk of lung cancer.
Example: In New York State in 2021, there were 77,214 asthma-related emergency department visits among an average population of 19,854,526 people.
To calculate the rate:
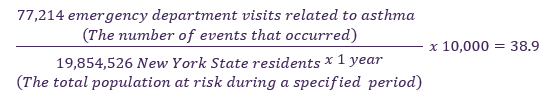
Among New York State residents in 2021, asthma-related emergency department visit rate was 38.9 per 10,000 New York State residents. In other words, for every 10,000 New York State residents, there were about 39 asthma-related emergency department visits.
Risk Ratio vs. Rate Ratio
In epidemiology, both the risk ratio and the rate ratio are specific quantities that we calculate to measure an association between a risk factor and an outcome. The risk factor could be a demographic group or a health behavior. The outcome may or may not be causal, as discussed earlier.
In specific, they are used to compare how likely a health outcome or condition is in one group of people compared with another. They can be used to find out if a certain group is more at risk for a health outcome or to determine if a certain exposure (like a risk factor, a behavior, or a new treatment) makes an outcome more or less likely.
The risk ratio compares the risk of a health outcome among one group with the risk in another group.
The rate ratio compares the rate of a health outcome among one group with the rate in another group.
How to calculate risk and rate ratios:
- Risk Ratio
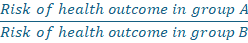
Tells us how many times more likely group A is to get the health outcome compared with group B, over a specified period.
- Example: Consider if the risk ratio for smokers (group A) getting lung cancer compared with nonsmokers (group B) was 5.0. This would mean smokers are 5 times as likely to develop lung cancer than nonsmokers during the specified period.
- Rate Ratio
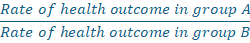
- Tells us how many times faster cases of the health outcome are occurring in group A compared with group B, over a specified period.
- Example: Consider if the rate ratio for lung cancer comparing smokers (group A) to nonsmokers (group B) was 10.0, This would means the rate of lung cancer is occurring at 10 times the rate (or 10 times the speed) in smokers compared to nonsmokers.
How to interpret risk and rate ratios:
- If the ratio is greater than 1, it means group A is at greater risk than group B.
- If the ratio is near or equal to 1, it means that group A and B are at equal risk.
- If the ratio is less than 1, it means that group A is at less risk than group B.
Experimental vs. Observational Studies
Studies are what epidemiologists call investigations. They are done to measure disease occurrence—in terms of incidence and/or prevalence and measures of them like risk and rate. Investigations are also done to measure the relationship between health factors and outcomes—in terms of associations and measures of them like risk-and rate-ratios.
There are two main types of epidemiological study designs: Experimental studies and observational studies. Both involve collecting and analyzing data to understand the relationships between health factors and outcomes.
Experimental Studies
Researchers use experimental studies when they want to establish a causal link between two or more factors.
- The researchers running the study have control over a variable (exposure, treatment, or factor) of interest.
- Experimental studies randomly assign study participants to comparison groups to determine the causal effect of an exposure, treatment, or factor on an outcome of interest.
- These studies reflect ideal conditions in controlled environments. They can be used to establish causality, where outcomes can be attributed to the variable of interest being manipulated.
Observational Studies
Researchers use observational studies when they want to identify an association between two or more factors. Sometimes this is done to increase understanding of whether a link is causal.
- In observational studies, the researchers conducting the study do not have, or have very limited, control over variables of interest. For example, exposures, treatments, or factors.
- Observational studies do not randomly assign study participants to comparison groups. They allow researchers to observe (not manipulate) variables to determine associations between those variables and outcomes of interest.
Specific Experimental and Observational Epidemiological Study Designs
One of the main goals of (etiologic) epidemiology is to answer the question: Did this exposure cause that health outcome? For example: does smoking cause lung cancer?
The best way to answer this question would be to compare the same person in two identical worlds where the exposure is the only difference:
- One where they were exposed. For example: they are a smoker
- One where they were not exposed. For example: they are not a smoker.
This is called the counterfactual — the “what if” world that didn’t or can’t actually happen.
Of course, we can’t split one person into two versions of themselves to see both outcomes at the same time. This is why we need study designs that get us as close as possible to that ideal comparison.
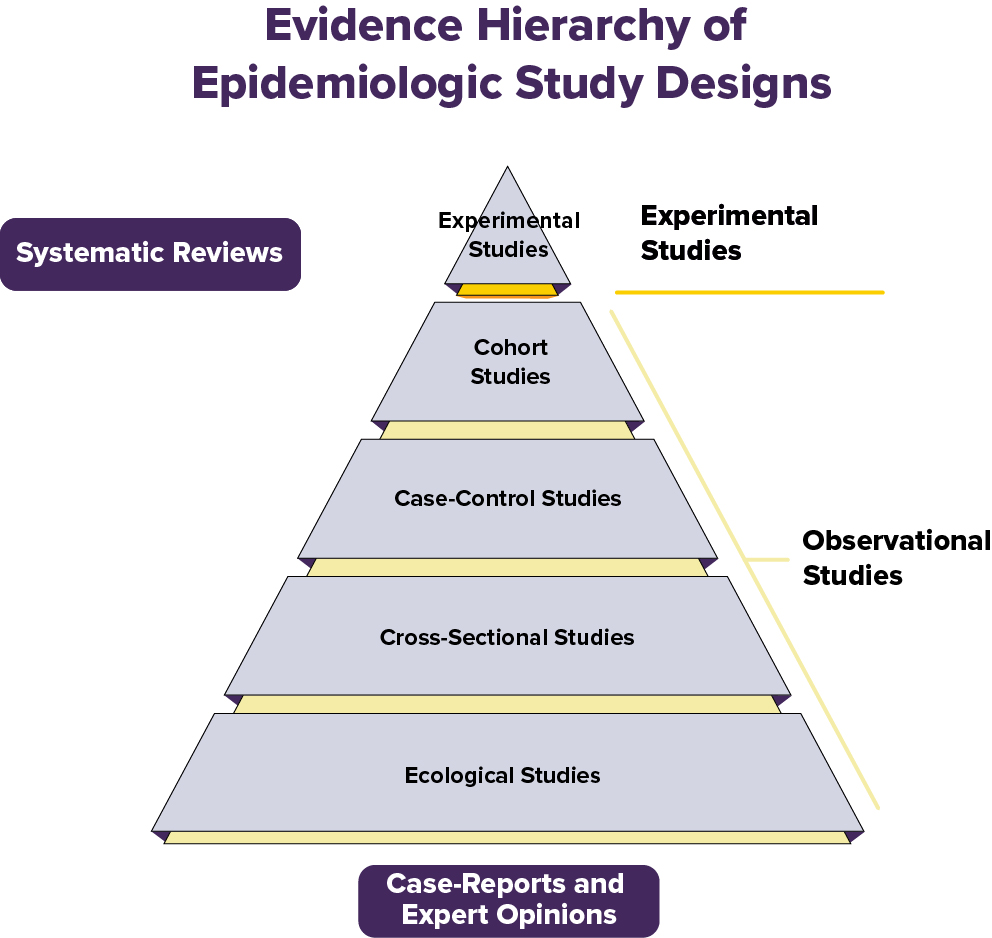
The Hierarchy of Evidence in Study Designs
Not all studies are equally strong when it comes to proving that a given exposure causes an outcome. In epidemiology and medicine, we think about a “hierarchy of evidence” — a pyramid that shows which study designs give us more dependable answers.
Experimental studies (the top of the pyramid) can establish a causal relationship between an exposure and outcome. All other study designs are observational and can only establish an association between an exposure and outcome.
We will describe several epidemiological study designs below.
Experimental Studies:
Randomized Controlled Trials (RCTs)
- Participants are randomly assigned to groups--for example, treatment vs. placebo. They are unaware of which group they are assigned to. This means they are blinded.
- Randomization helps remove other factors that could impact the study results. This makes it easier to tell if the treatment really works.
Example: A group of volunteers with cancer is randomly assigned to take a new medicine or a placebo. Researchers assess whose cancer has improved.
The randomized controlled trial is often called the gold standard because:
- Randomizing participants into exposure groups balances out known and unknown factors between groups.
- Blinding reduces bias. Blinding is not telling participants and/or research staff who is in which exposure group, when possible.
- The comparison between groups makes it easier to see if the treatment or exposure really caused the outcome.
Still, no study is perfect—randomized controlled trials can be expensive and time-consuming. Also, they are not always ethical or appropriate. For example, we might suspect a certain food additive is harmful and want to confirm via research. It would not be ethical to intentionally assign some people to consume the additive. That’s why all study types have a role, depending on the research question.
Observational Studies:
Cohort Studies
- Evaluate groups of people who were exposed or unexposed to a potential risk factor over time to see who develops a certain outcome.
- Epidemiologists compare the occurrence of the outcome between the exposed and unexposed group using measures like the risk-ratio or rate-ratio. These measures help epidemiologists determine the strength of the association between the risk factor and outcome.
- Good for studying risk factors, especially rare ones. But cohort studies may take a long time to conduct. They can also be affected by biases including confounding.
Example: A group of people who smoke and a group of people who do not smoke are followed for 20 years to see how many in each group develop lung cancer.
Case-Control Studies
- Assess people who already have the health condition or outcome (cases) and people without it (controls). Ask about their past exposure history.
- Useful for rare outcomes, but more prone to recall bias. This is when people incorrectly remember or report past events.
Example: Researchers start with people who already have lung cancer (cases) and compare their past smoking history with people who don’t have lung cancer (controls).
Cross-Sectional Studies
- Evaluate data from a single point in time (“a snapshot”).
- Helpful for finding associations but can’t show cause and effect, because we do not know if the cause (exposure) happened before or after the effect (outcome).
Example: A survey asks thousands of people at one point in time whether they currently smoke and whether they currently have lung cancer.
Cross-Sectional Studies
- Evaluate data from a single point in time --“a snapshot.”
- Helpful for finding associations but can’t show cause and effect. Why? Because we do not know if the cause (exposure) happened before or after the effect (outcome).
Example: A survey asks thousands of people whether they smoke and whether they have lung cancer.
Ecological Studies
- Compare groups or populations (not individuals) — for example, country-level smoking rates and lung cancer rates.
- Quick and cheap, but weak because group-level trends don’t always apply to individuals. This is called ecological fallacy.
Example: Scientists compare average national smoking rates with national lung cancer death rates across different countries.
Systematic Reviews and Meta-Analyses:
- Includes results from a group of studies to give the most complete picture (i.e., combine the available evidence or data).
- Can be strong because they may increase the confidence in findings (by increasing precision and reducing bias) by assessing and pooling many studies and their data.
- Systematic reviews are a descriptive summary of patterns and findings from a group of research studies. Meta-analyses combine data from separate, similar studies to produce overall statistical results.
Example: Researchers gather all published papers on whether smoking is associated with lung cancer, then summarize the results across all studies.
Reliability vs. Validity
Reliability and validity are two very important concepts related to measurements and methods in research. All valid measurements and methods are reliable, but not all reliable measurements and methods are valid.
To make accurate conclusions, it is important that our measurements and methods are both reliable and valid.
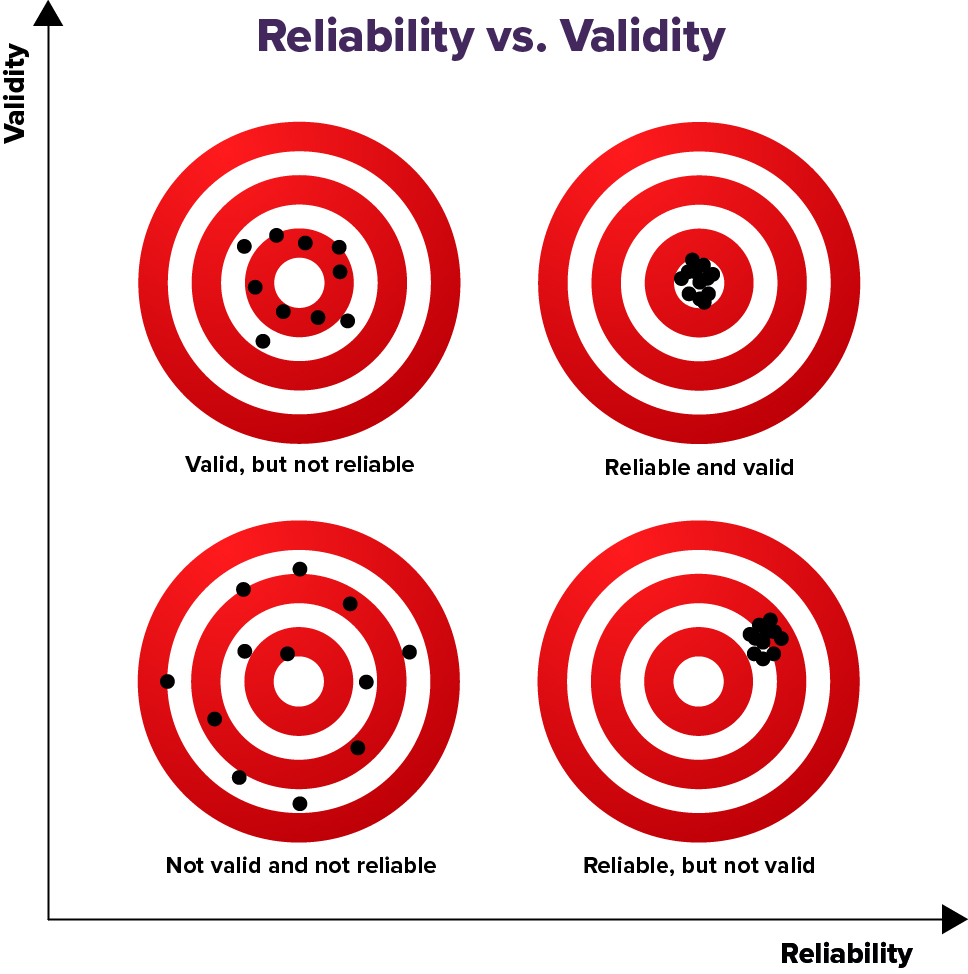
Reliability is how consistent a measurement or method is. In research, if the results or measurements are the same or similar over repeated measurements--then those results or measurements and those methods of getting them are reliable.
Examples:
- Measuring your weight repeatedly on a scale and getting the same (or similar) results every time under similar conditions.
- Measuring your temperature repeatedly with a thermometer and getting the same (or similar) results every time under similar conditions.
Validity refers to how well a measurement represents what is true. In research, if results or measurements obtained from different, reliable methods are the same or similar over repeated measurements--then those results and the methods of getting them are valid. They likely represent what is true.
Examples:
- Measuring your weight using different scales and getting the same (or similar) results every time under similar conditions.
- Measuring your temperature using different thermometers and getting the same (or similar) results every time under similar conditions.
Random Error vs. Nonrandom Error
Random error, also known as chance error, affects the precision of measurements. Random error refers to unpredictable, inconsistent changes that can happen each time you measure or observe something. These differences are usually caused by factors that are either unknown or beyond our control.
Example: You have an apple that weighs 150 grams (g). If you weigh it several times, you might get a slightly different result each time--like 150g, 152g, 149g, 151g, 148g, or 150g.
Nonrandom error, also known as systematic error, affects the accuracy of measurements. Nonrandom error is a predictable, consistent error that happens each time you measure or observe something. This type of error usually happens because there is a problem with the system, tools, or procedures used for measuring or observing.
Example: You have an apple that weighs 150g. If the scale is not working correctly and adds 10g to each measurement, that extra 10g is a nonrandom, or systematic error. It’s nonrandom because it happens the same way every time.
Key Differences Between Random and Nonrandom Errors
Feature Random Error Nonrandom Error Pattern Unpredictable, inconsistent Predictable, consistent Cause Natural variation, chance Faulty tool, biased method Fixability Reduced by repeating and averaging Must be identified and corrected Primarily Affects Precision Accuracy Sensitivity vs. Specificity
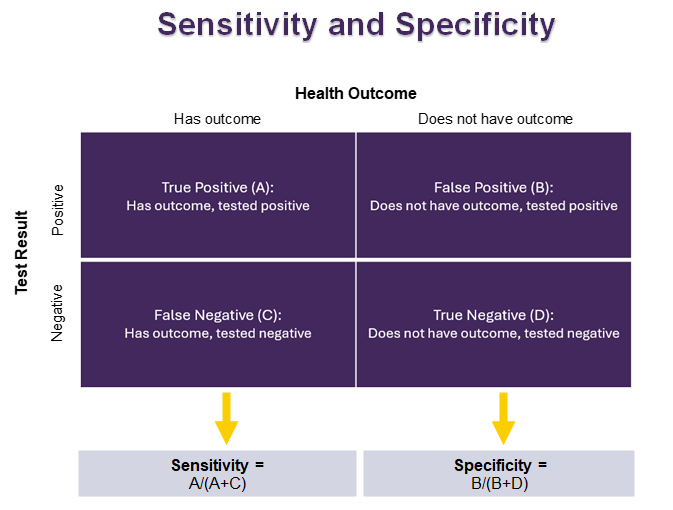
Sensitivity and specificity are used to see how well a test correctly identifies people who do or do not have a certain health outcome. These two measures are important for creating tests that are both accurate and consistent. This helps us to successfully identify individuals with specific health outcomes.
Sensitivity shows how many people who have a health outcome test positive.
- It ranges from 0 to 100%, with a higher percent indicating higher sensitivity.
- If a test is very sensitive:
- It is good at finding the health outcome when it is there.
- There are not many false negatives. A false negative is when the test says someone doesn’t have the health outcomes, but they really do.
Specificity shows how many people who do not have the health outcome test negative.
- It ranges from 0 to 100%, with a higher percent indicating higher specificity.
- If a test is very specific:
- It is good at saying that someone does not have the health outcome when they really don't.
- There are not many false positives. A false positive is when the test says someone has the health outcome, but they really don’t.
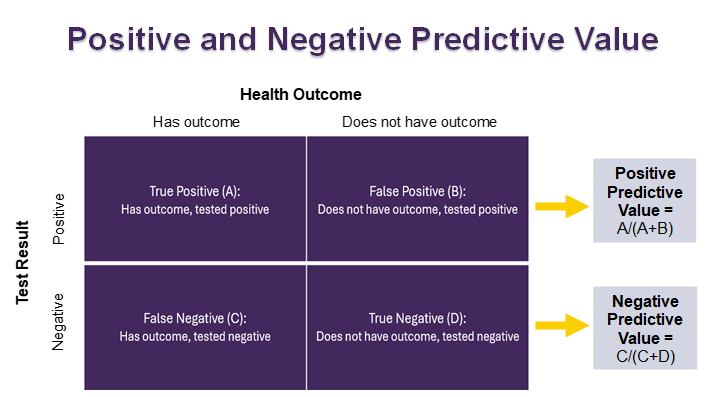
Positive Predictive Value vs. Negative Predictive Value
Positive predictive value and negative predictive value help us figure out how likely it is that a given test result is correct. This helps us determine whether further testing may be necessary to confirm or rule out health outcomes.
Positive predictive value (PPV) shows the chance that someone has a health outcome if they tested positive for it.
- Ranges from 0 to 100%, with a higher percent indicating higher positive predictive value.
- If a test has a high positive predictive value:
- There is a high chance that a person has the health condition if they test positive for it.
- There is a low chance that a person does not have the health condition if they test positive for it.
Negative predictive value (NPV) shows the chance that someone does not have a health outcome if they tested negative for it.
- Ranges from 0 to 100%, with a higher percent indicating higher negative predictive value.
- If a test has a high negative predictive value:
- There is a high chance that a person does not have the health condition if they test negative for it.
- There is a low chance that a person does have the health condition if they test negative for it.
Major types of Bias in Epidemiological Research that can impact results: Selection, information, and confounding
Bias is a form of nonrandom error in epidemiological studies. It can lead to incorrect or misleading results about the association between health factors and outcomes.
While there are many types of bias that can occur in epidemiological studies, they can be categorized into three main types: Selection bias, information bias, and confounding.
Below, we provide information about each of these three types of bias and provide some specific examples.
Selection bias: Occurs when the people in the study (the sample) does not represent the population that the researchers are trying to draw conclusions about. At the same time, the sampled group differs from the full population in terms of the factors being studied.
Some specific examples of Selection Bias include:
- Sampling bias: We want to gather opinions on a topic from the general population. If we conduct a study that uses only an internet survey, people without internet access will not be included. So, the study sample will not represent the whole population. People without internet access may differ from those with access regarding the issues being measured and studied. If this is the case, then the findings may be biased and not reflect the “truth” in the whole population. This type of selection bias can often result from convenience or “judgmental” sampling, where samples are selected for study in a nonrandom way.
- Self-selection bias: We want to understand if college students are getting enough exercise. If the only people who choose to enroll in our study are student athletes, the study sample will not represent the entire college student population.
Healthy worker effect: If researchers compare the working population to the general population, a bias will result. This is because the general population includes all people regardless of illness or disability. The working population includes only those capable of working.
Information bias: Occurs when there are problems with how study information is collected. This can include issues with how people collect and interpret information, the tools used to measure information, and how information is reported by people in the study.
Examples:
- Recall bias: If we are asking study participants about things that they did many years ago, it may be hard for them to provide accurate answers. They may not remember. A nutrition study asking people to list all the foods they ate last year, last month, or even last week would not collect accurate information.
- Confirmation bias: Researchers may, intentionally or unintentionally, favor information that confirms their beliefs and ignore information that does not. This can influence what they choose to study, how they collect and record information, and the way they interpret and share study results.
- Hawthorne effect: Participants in a study modify their behaviors or responses due to their awareness of being studied or observed. A study looking to see if workers show up to work on time would be impacted by this bias if researchers told the workers in advance. Workers may modify their routine to ensure they are on time or early for work since they know they are being watched.
- Confounding: Occurs when the association between an exposure and outcome is actually the result of another factor. The other factor is known as a confounder. To be considered a confounder, the factor must be linked to both the exposure and the outcome.
Example:
- There is an association between drinking alcohol and lung cancer. People who drink alcohol are more likely to have lung cancer. However, it should not be concluded that drinking alcohol causes lung cancer. People who drink alcohol are more likely to smoke cigarettes than people who do not drink alcohol. Cigarette smoking is the confounder in the association between alcohol and lung cancer and is the true cause of lung cancer. When we take cigarette smoking into account, the association between drinking alcohol and lung cancer goes away.
What Are Some Tools Used to Control for Confounding?
All studies have potential confounders. Epidemiologists use several tools to reduce the effects of confounding during different phases of research.
While Setting Up the Study (Study Design):
Randomization: A study with two groups randomly assigns participants to either group. The potential confounders are more likely to be evenly spread across both study groups. This balancing of the confounding factors can remove their ability to influence the study findings.
Example: Randomly assigning people to a group that receives a new drug or a group that receives a placebo. This assignment helps ensure that both groups are fairly equal in potential confounding factors like age or health status of the people in the groups.
Restriction: An epidemiologist can remove the impact of a confounder by restricting the group of people they are studying based on that confounder. Restriction can be completed before a study begins or when data are being analyzed.
Example: If biological sex is a confounder, we can remove the impact of the sex by restricting the group of people being studied to only one sex. This can be done when selecting participants or when analyzing results. However, this also limits the ability to apply the study results to a wider group of people.
Matching: In a case-control study, an epidemiologist can reduce the impact of a confounder by creating a similar distribution of confounders in both groups being studied.
Example: If biological sex and age are confounders, we can remove their impact by matching participants by these factors. For each 45-year-old male with the health outcome (case), the epidemiologist would select a matching 45-year-old male without the health outcome (control).
While Evaluating the Data (Data Analysis):
Stratification: We can analyze data separately for each group (or “strata”) of the confounder.
Example: Analyze results separately for men and women, if sex might confound the association between the exposure and the outcome.
Standardization: An epidemiologist can apply statistical methods to adjust for differences in the demographic composition between populations. This is done so they can be compared fairly, in an apples-to-apples way.
Example: A researcher may want to compare the rate of a disease between two counties, but one county has a much older population. We can compare the rate of disease between the two counties by adjusting to a “standard” age distribution.
Additional Resources
- ActivEpi - ActivEpi is an electronic textbook for teaching epidemiology, available free online